Turning data into decisions
City Builder helps investors identify opportunities to fund projects that strengthen communities. The platform makes complex investment data easier to explore and act on.

The opportunity
City Builder gives investors looking to impact communities access to socio-economic and investment data, but the information can be complex and difficult to evaluate.
I designed 30+ enhancements that helped investors filter, explore, and understand data in context. I helped investors calculate investment costs, map incentive zones and understand socioeconomic trends.

The three enhancements
While I worked on 30+ enhancements for this project, we will explore three enhancements that helped investors move from information to understanding to action.
1. Find the right investment
2. Help investors see change over time
3. Understand incentive zones
Find the right investment
The estimated cost filter allowed investors to quickly narrow investment opportunities based on project cost.
We were solving for how can someone quickly understand the range of investment opportunities and narrow it to what's relevant to them?

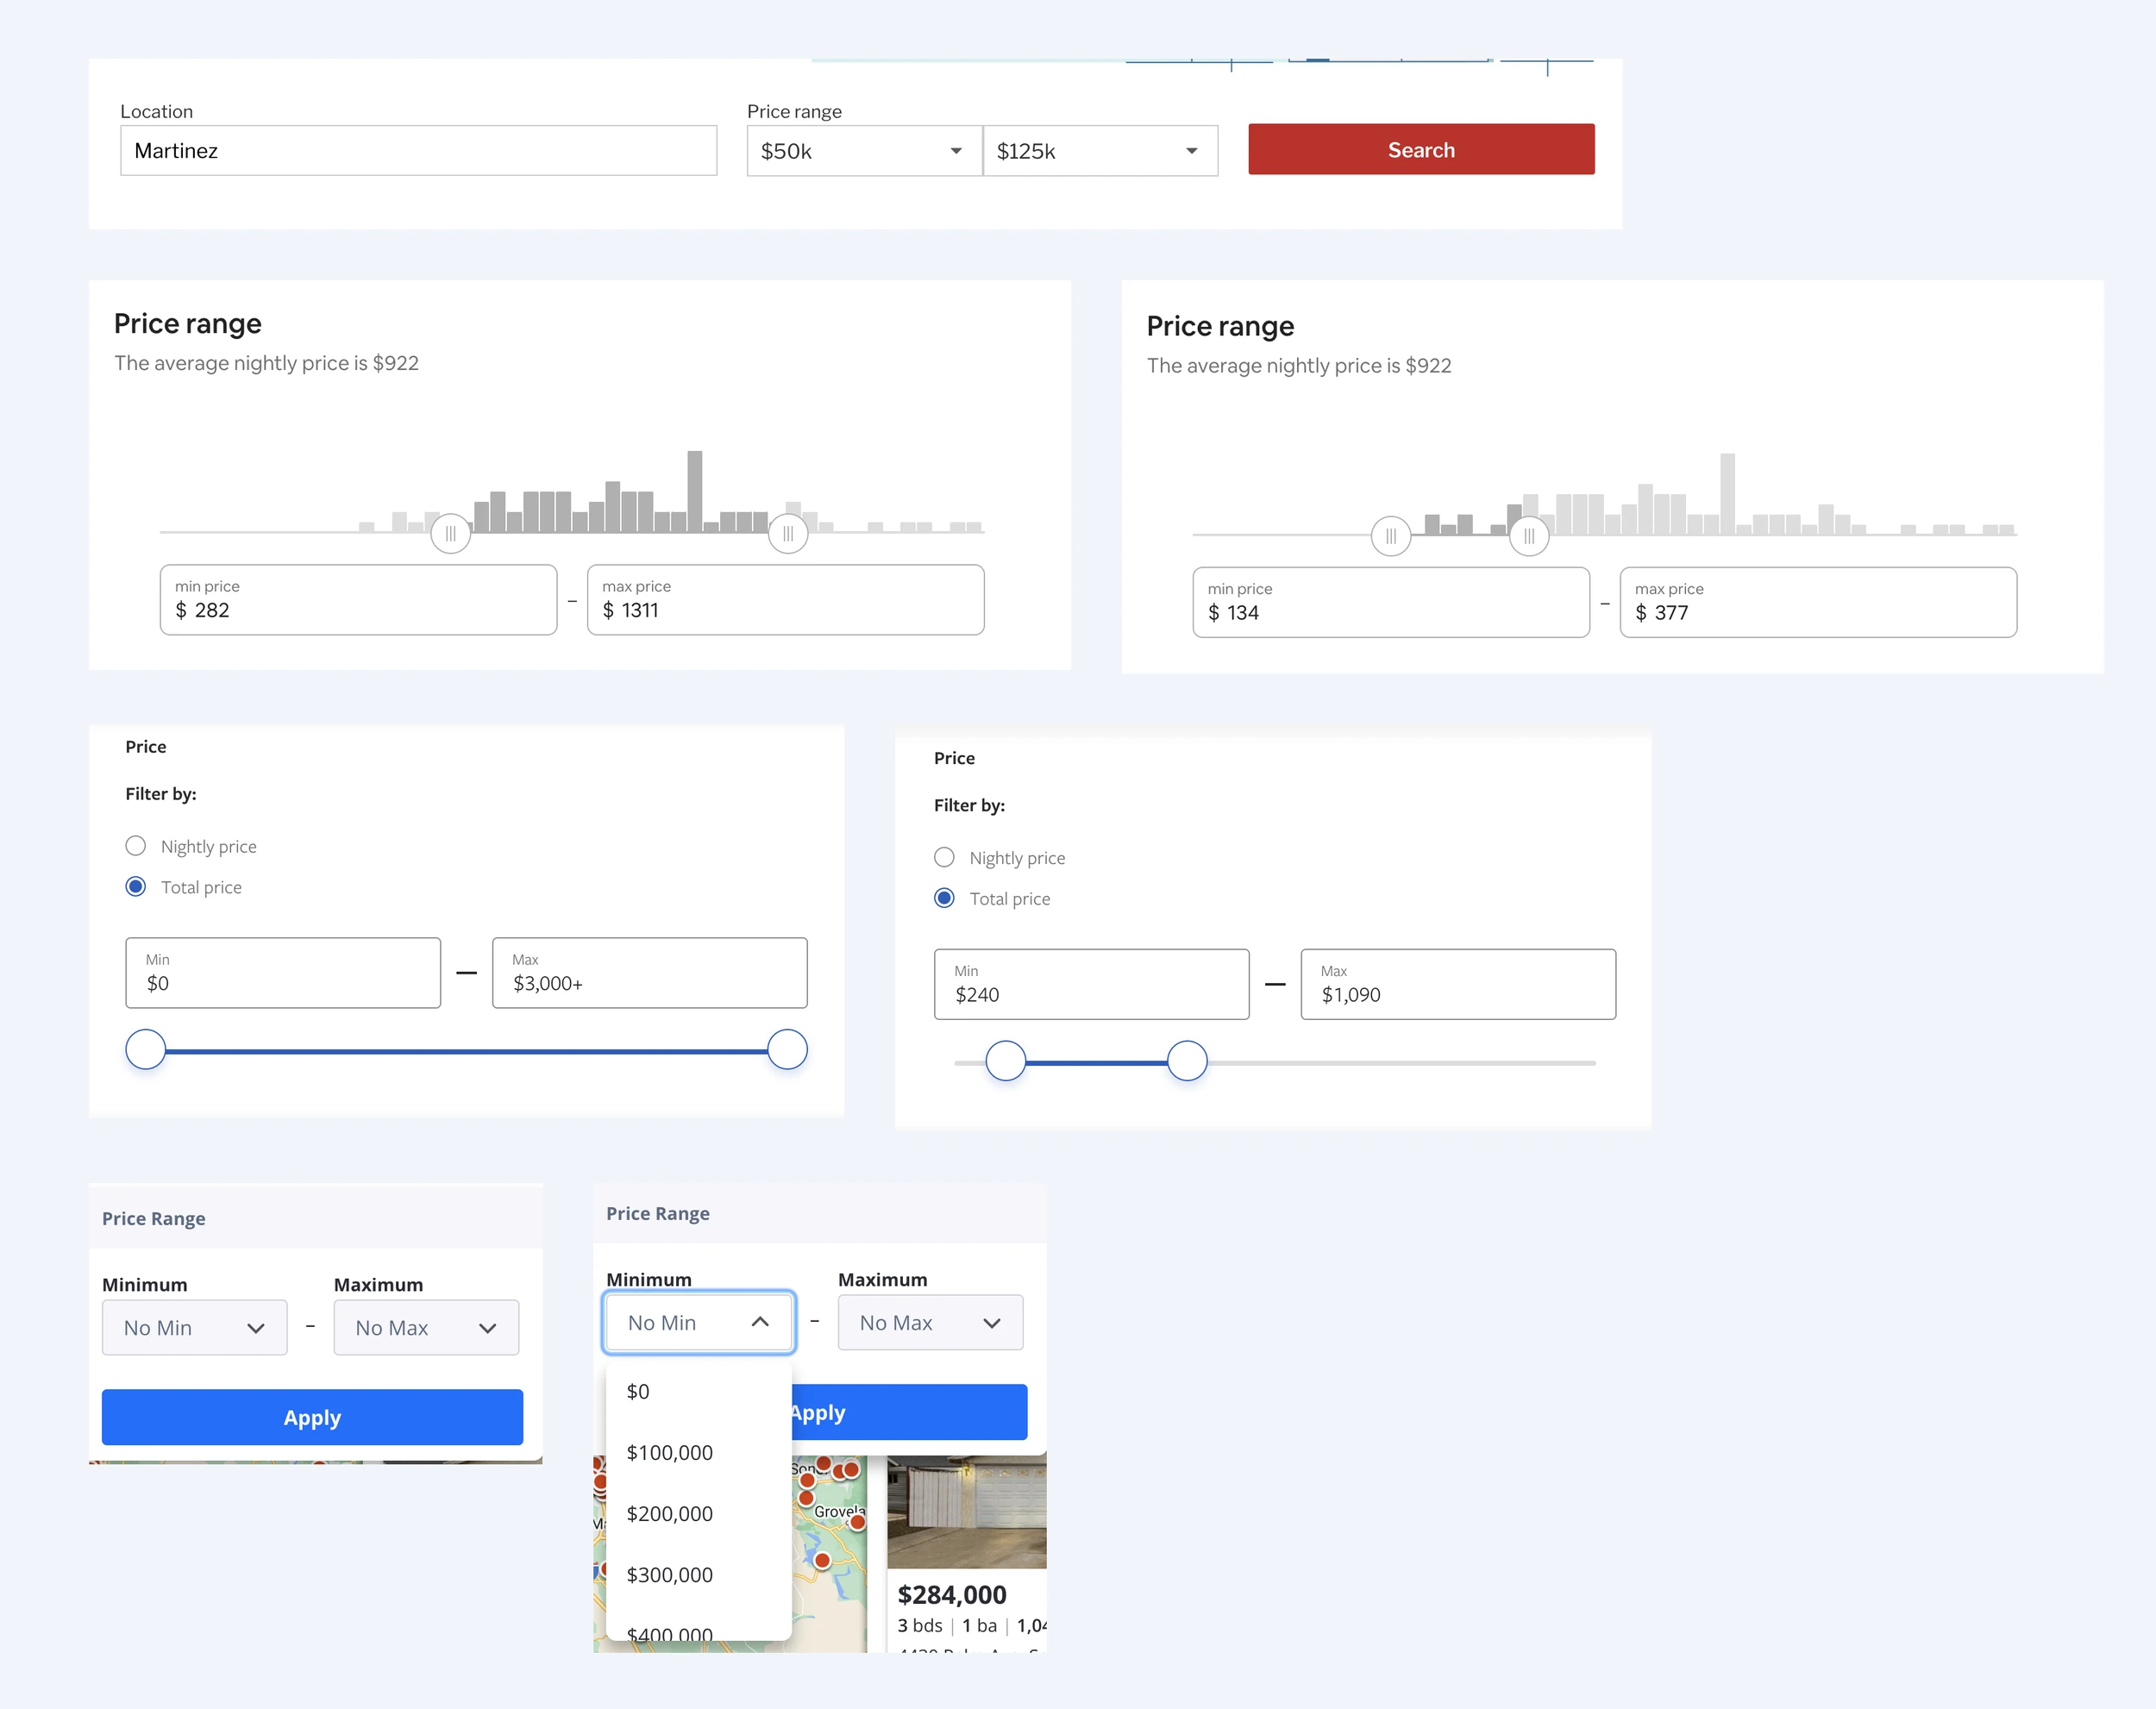
Benchmarking
Exploring different ways to express large numerical ranges
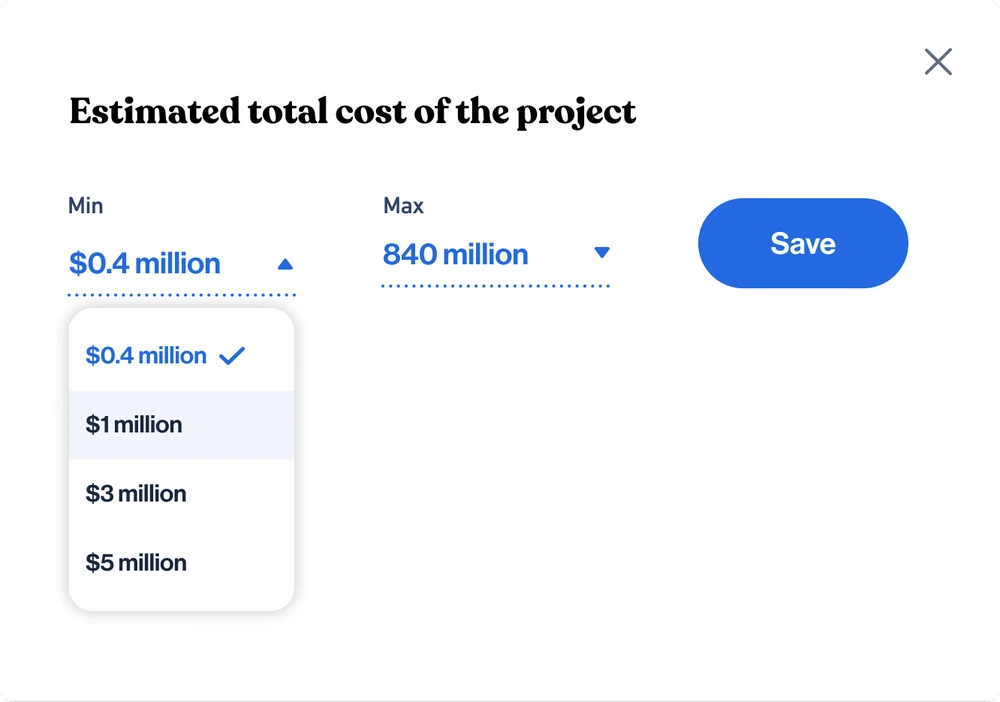
Ideation
Testing how much context users need while adjusting the range.

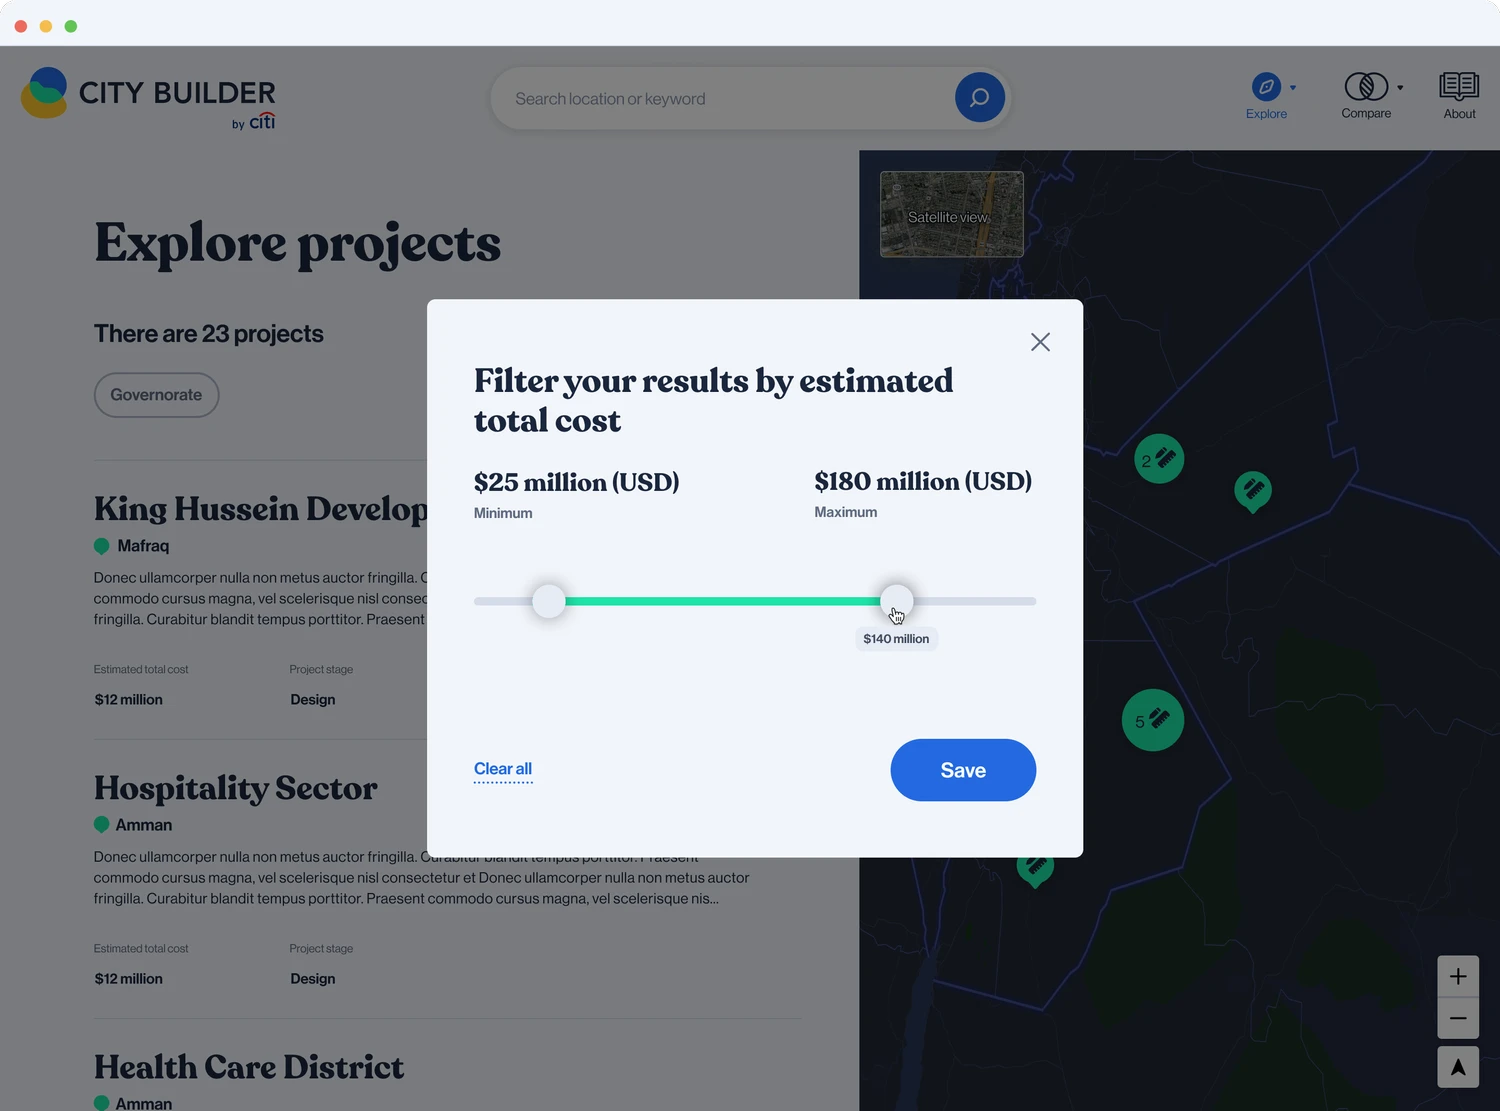
Final direction
A flexible range slider with immediate feedback.

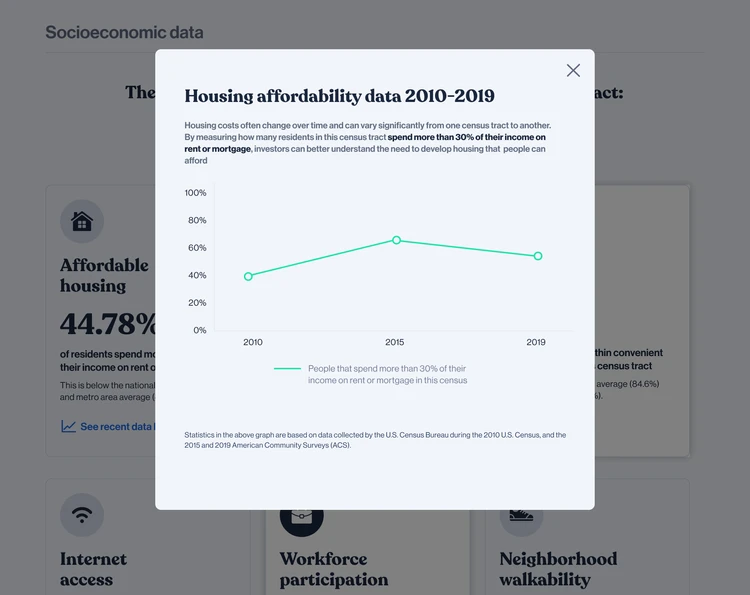
Help investors see change over time
City Builder contained socioeconomic data from multiple years, but simply presenting numbers wouldn't help investors understand how a community was changing.
We were solving for how can we make change over time easy to see and explore?
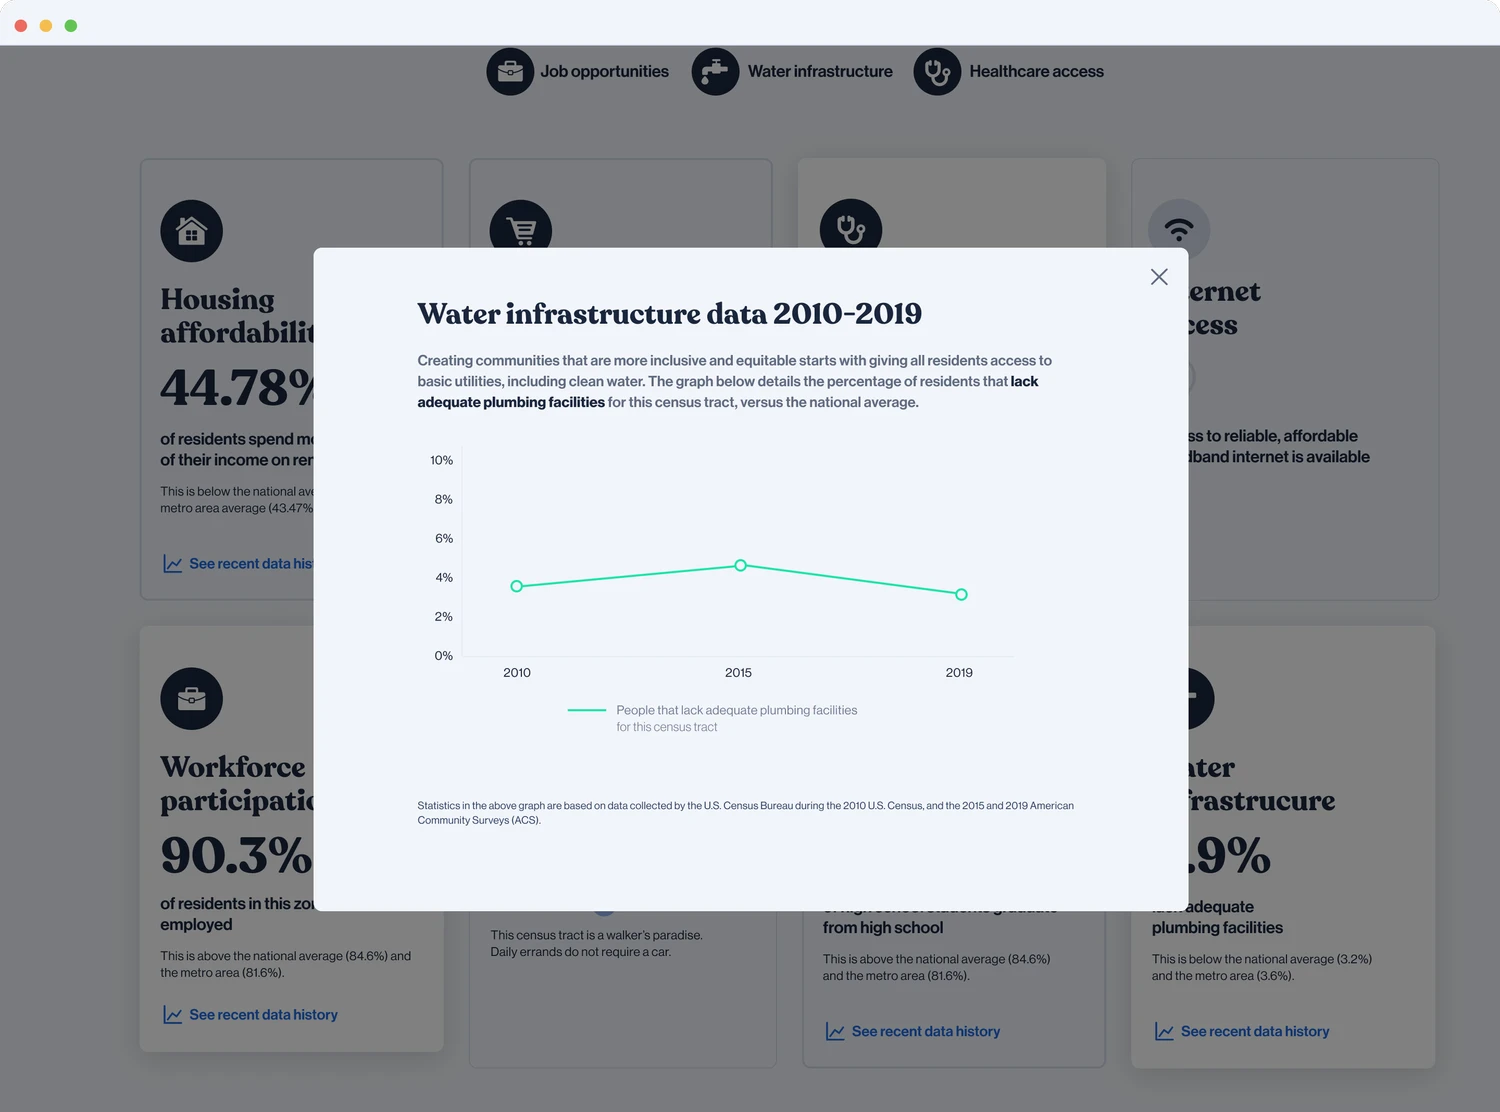
Benchmarking
Exploring how graphs tell a story about data
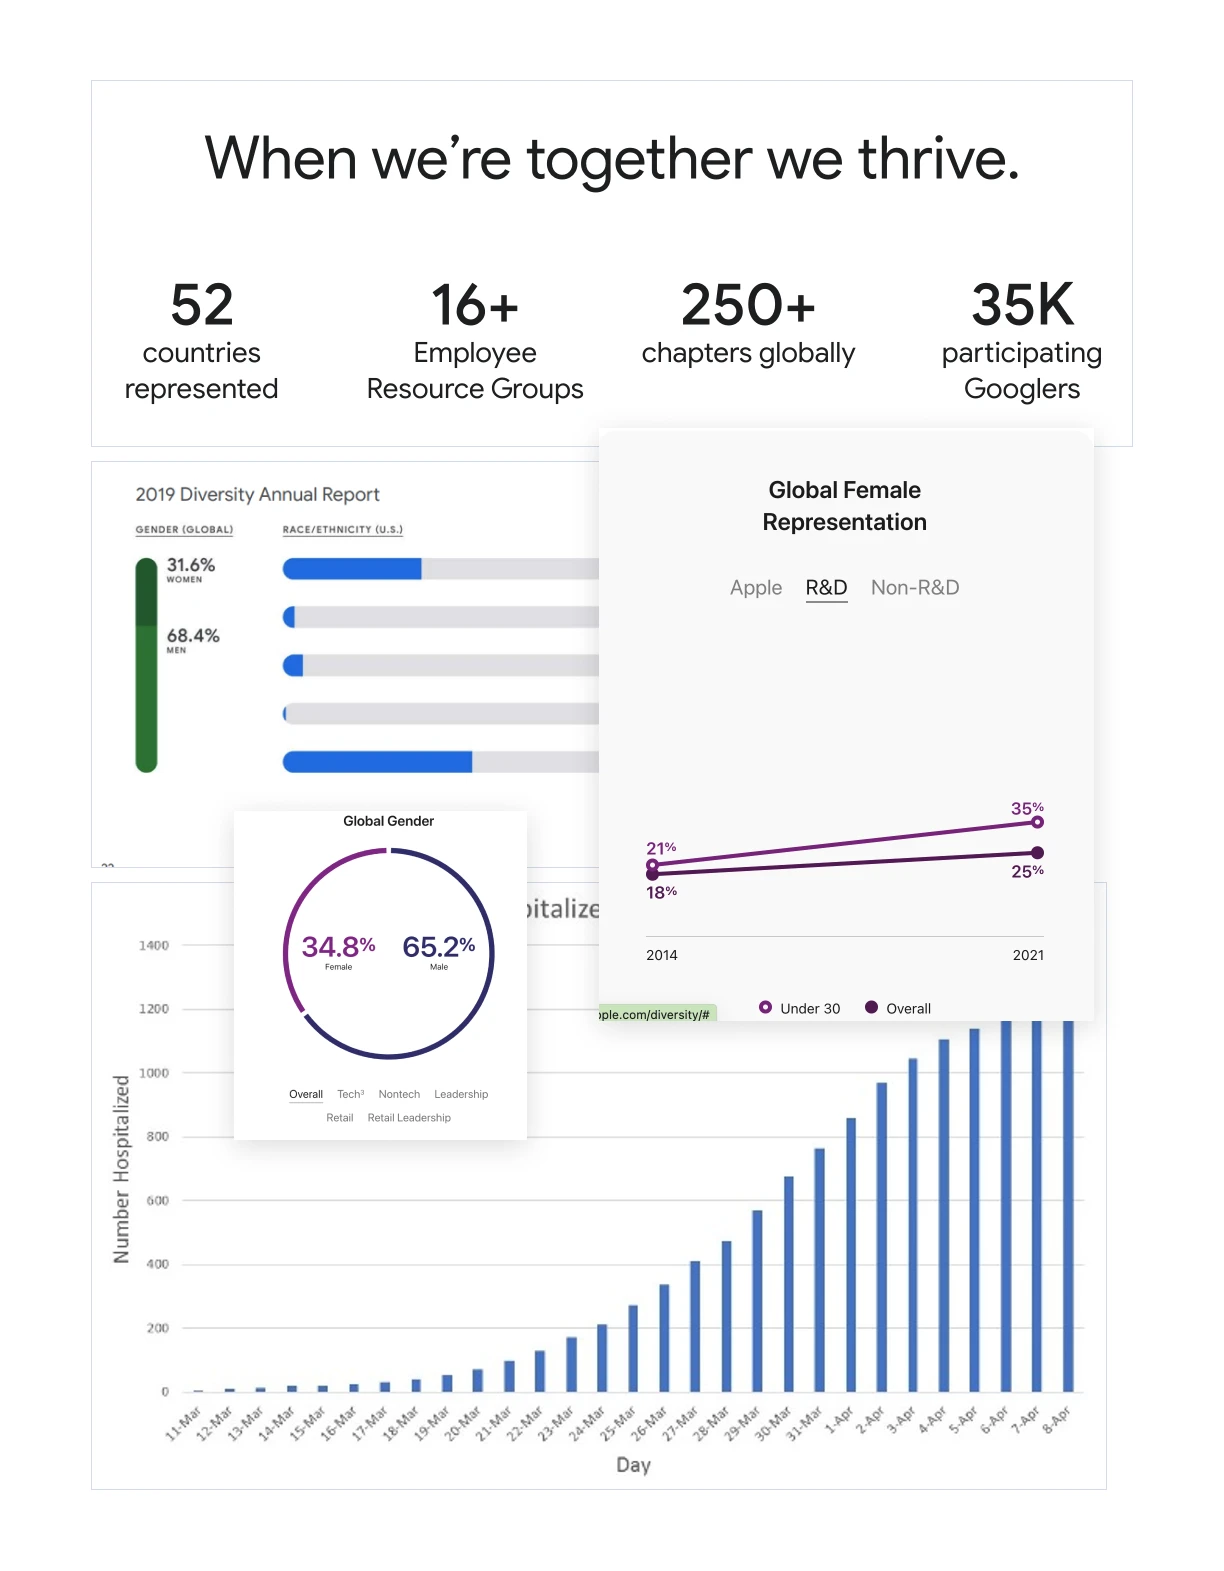
Ideation
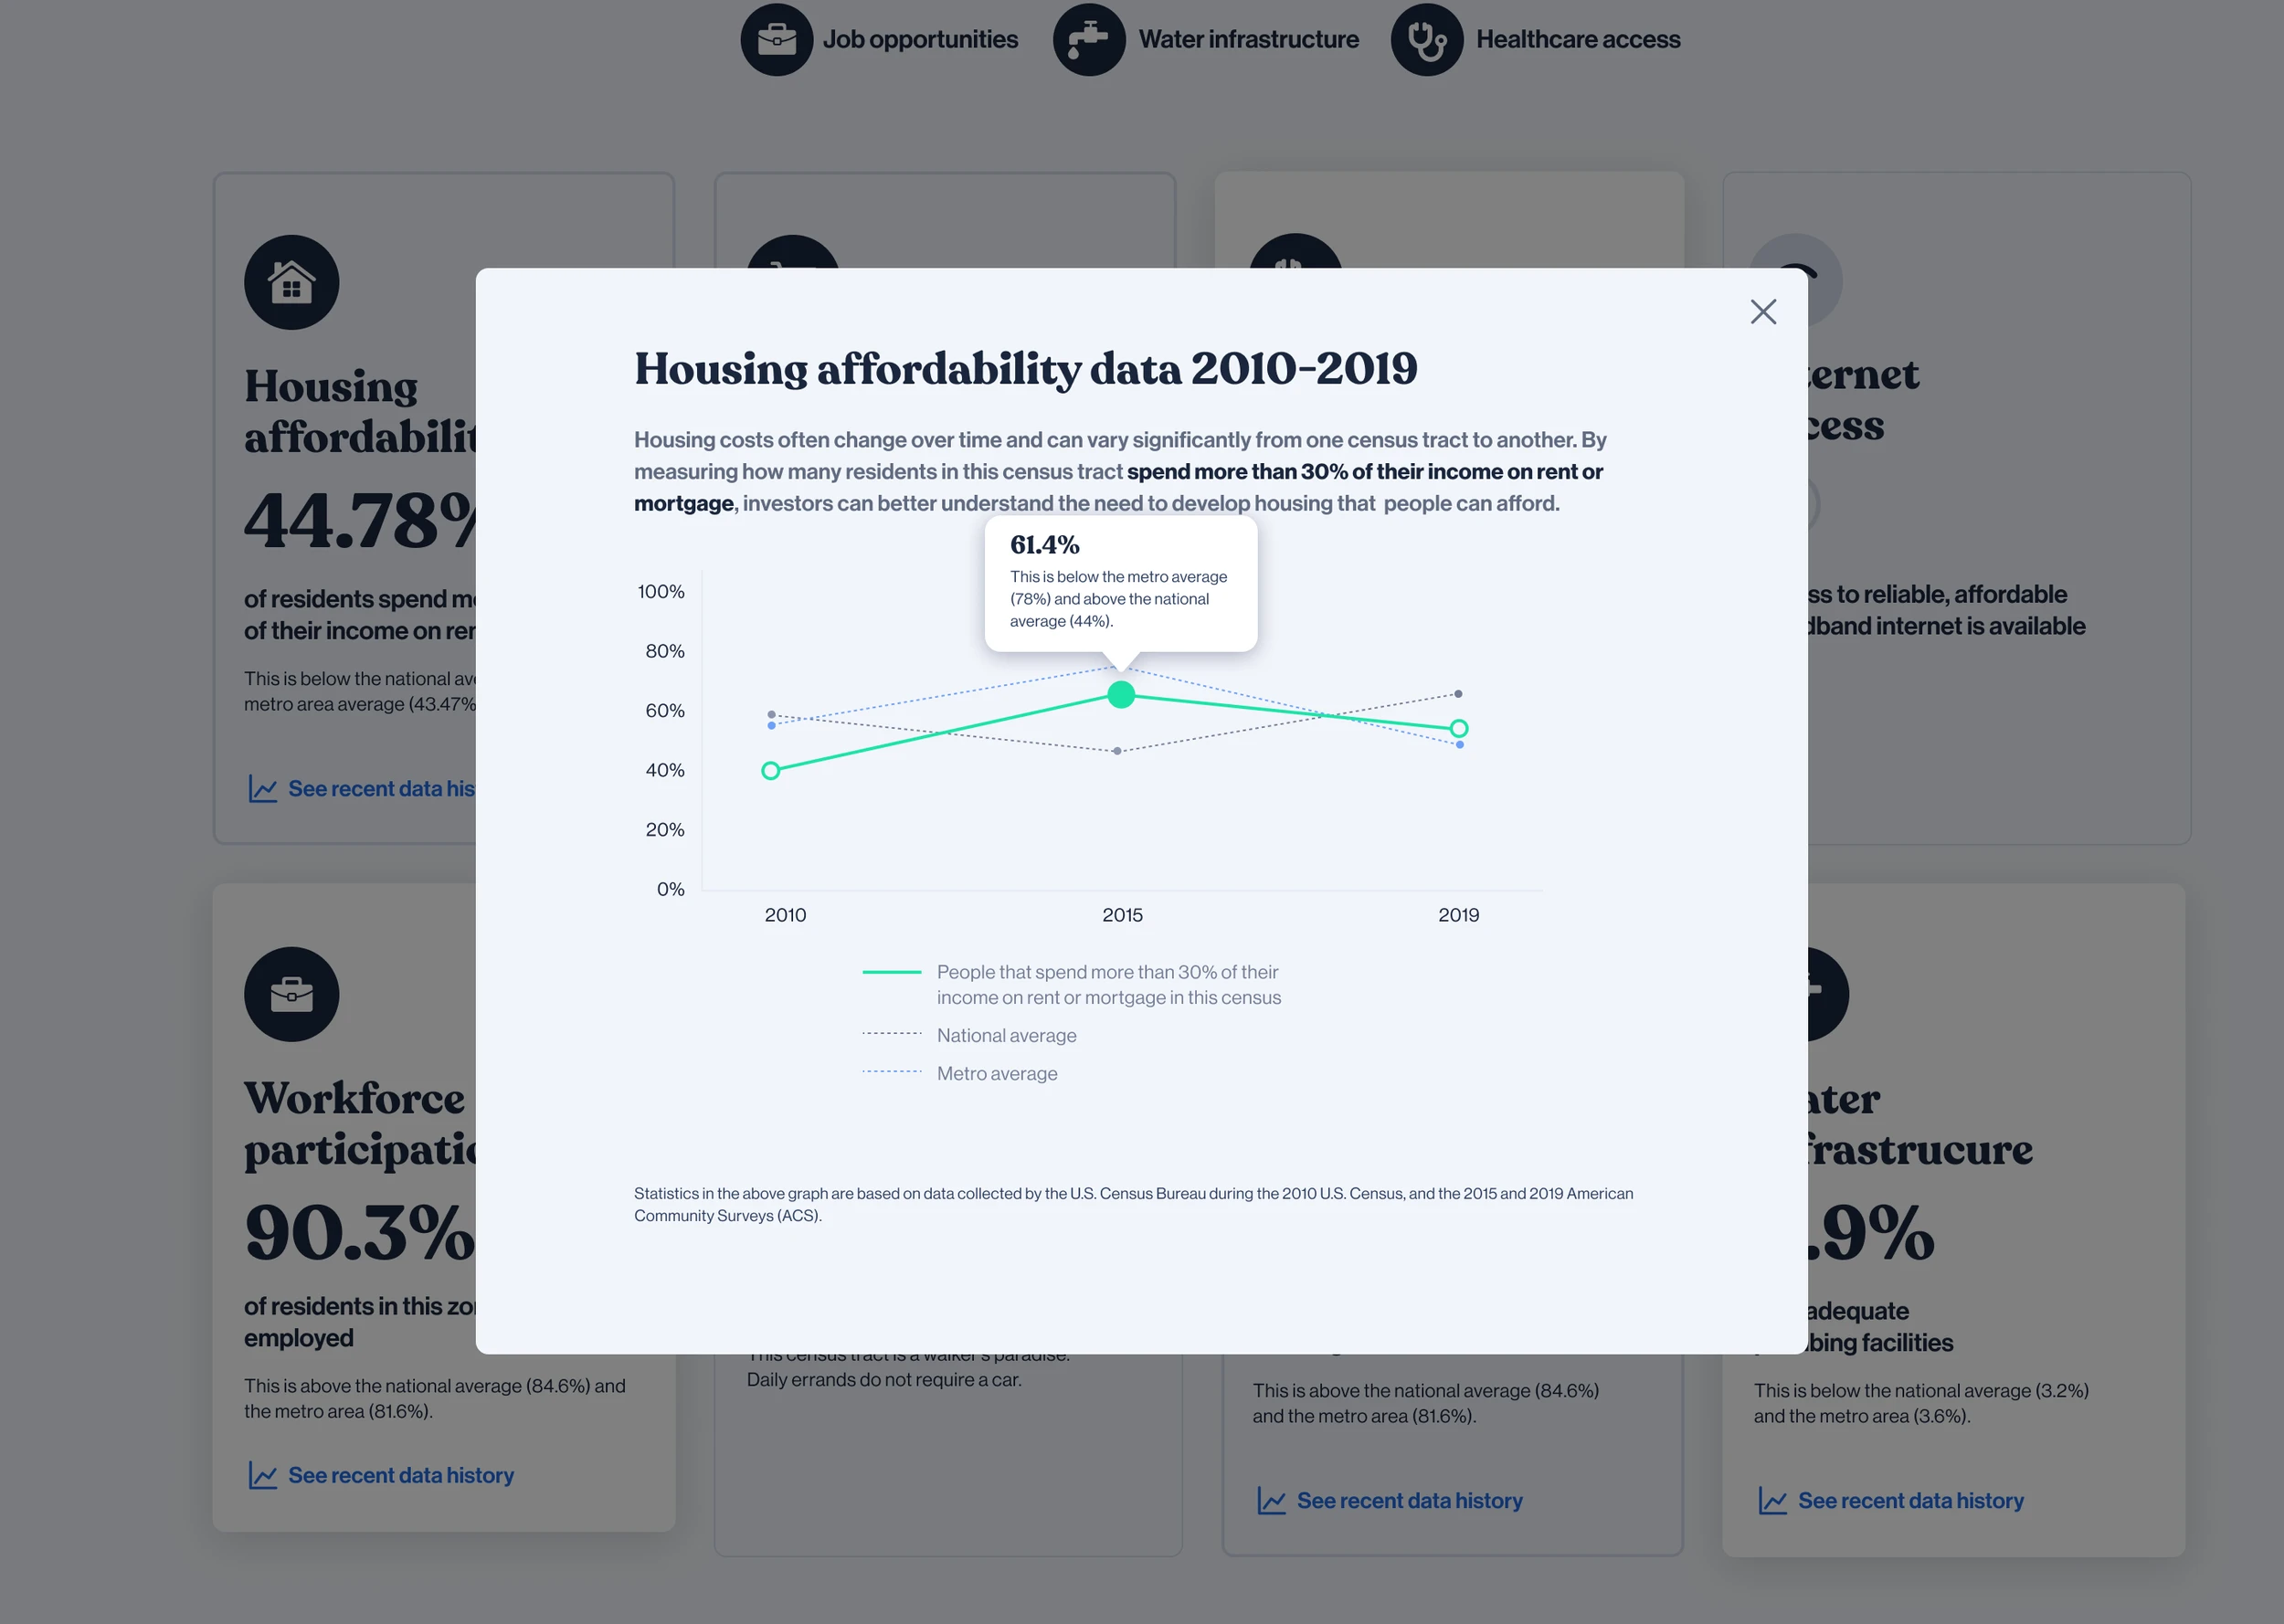
Explored line graphs, pie charts, and bar charts before moving toward an interactive line graph with specific data points and hover states.
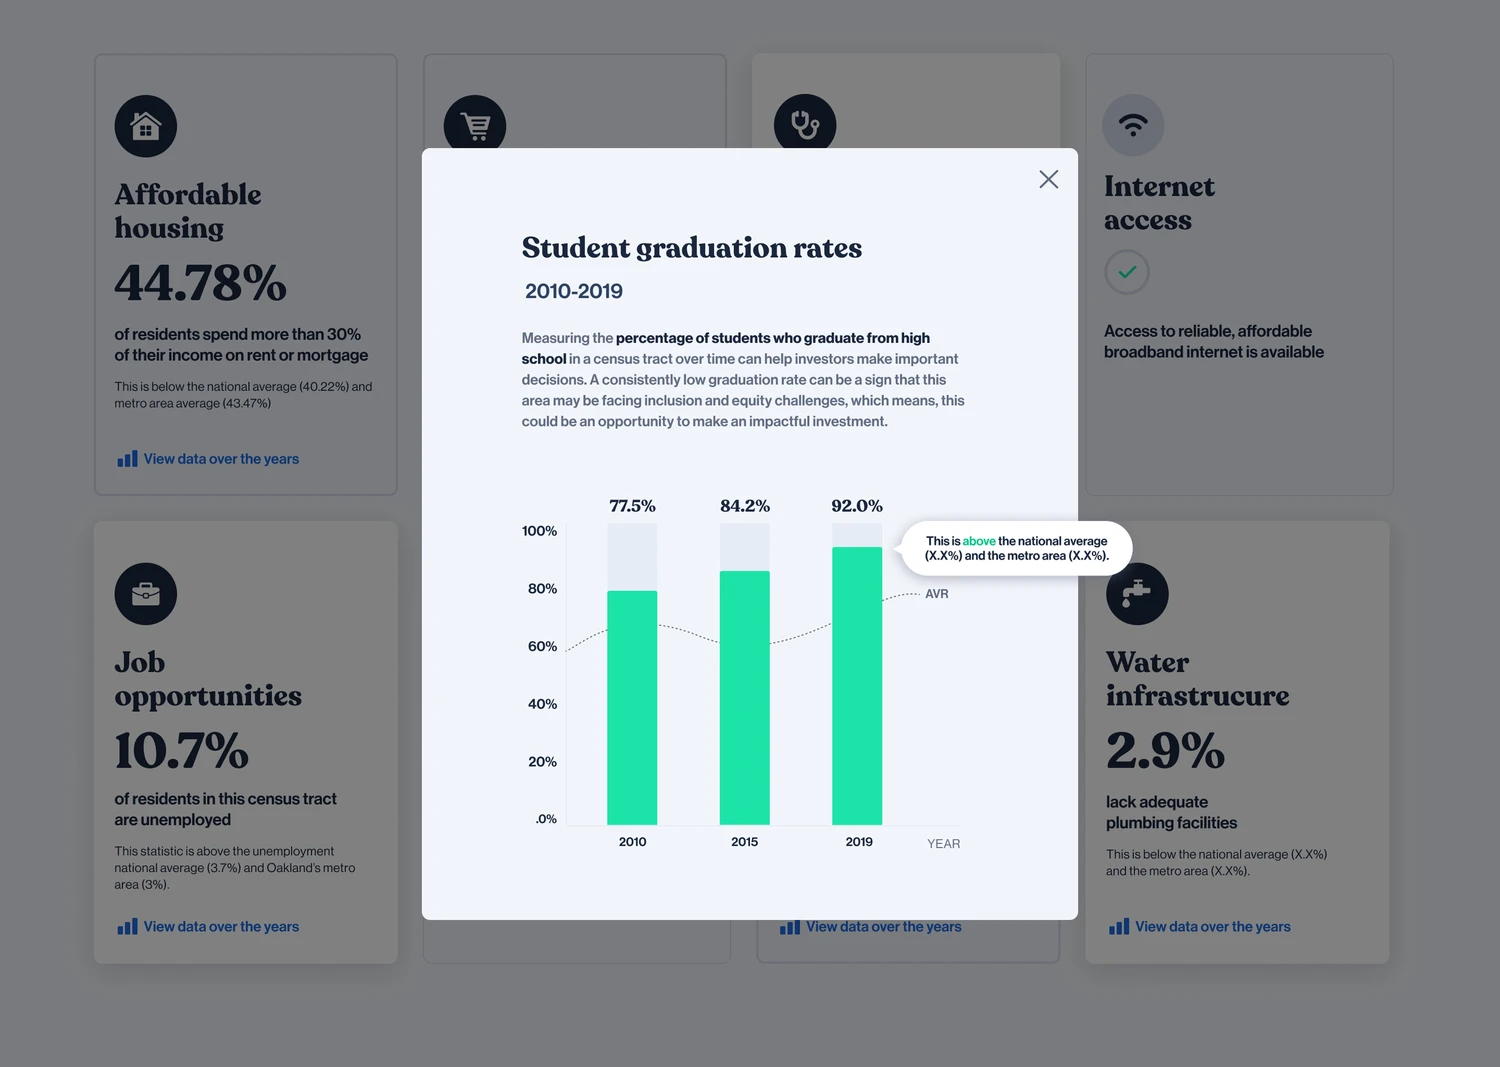

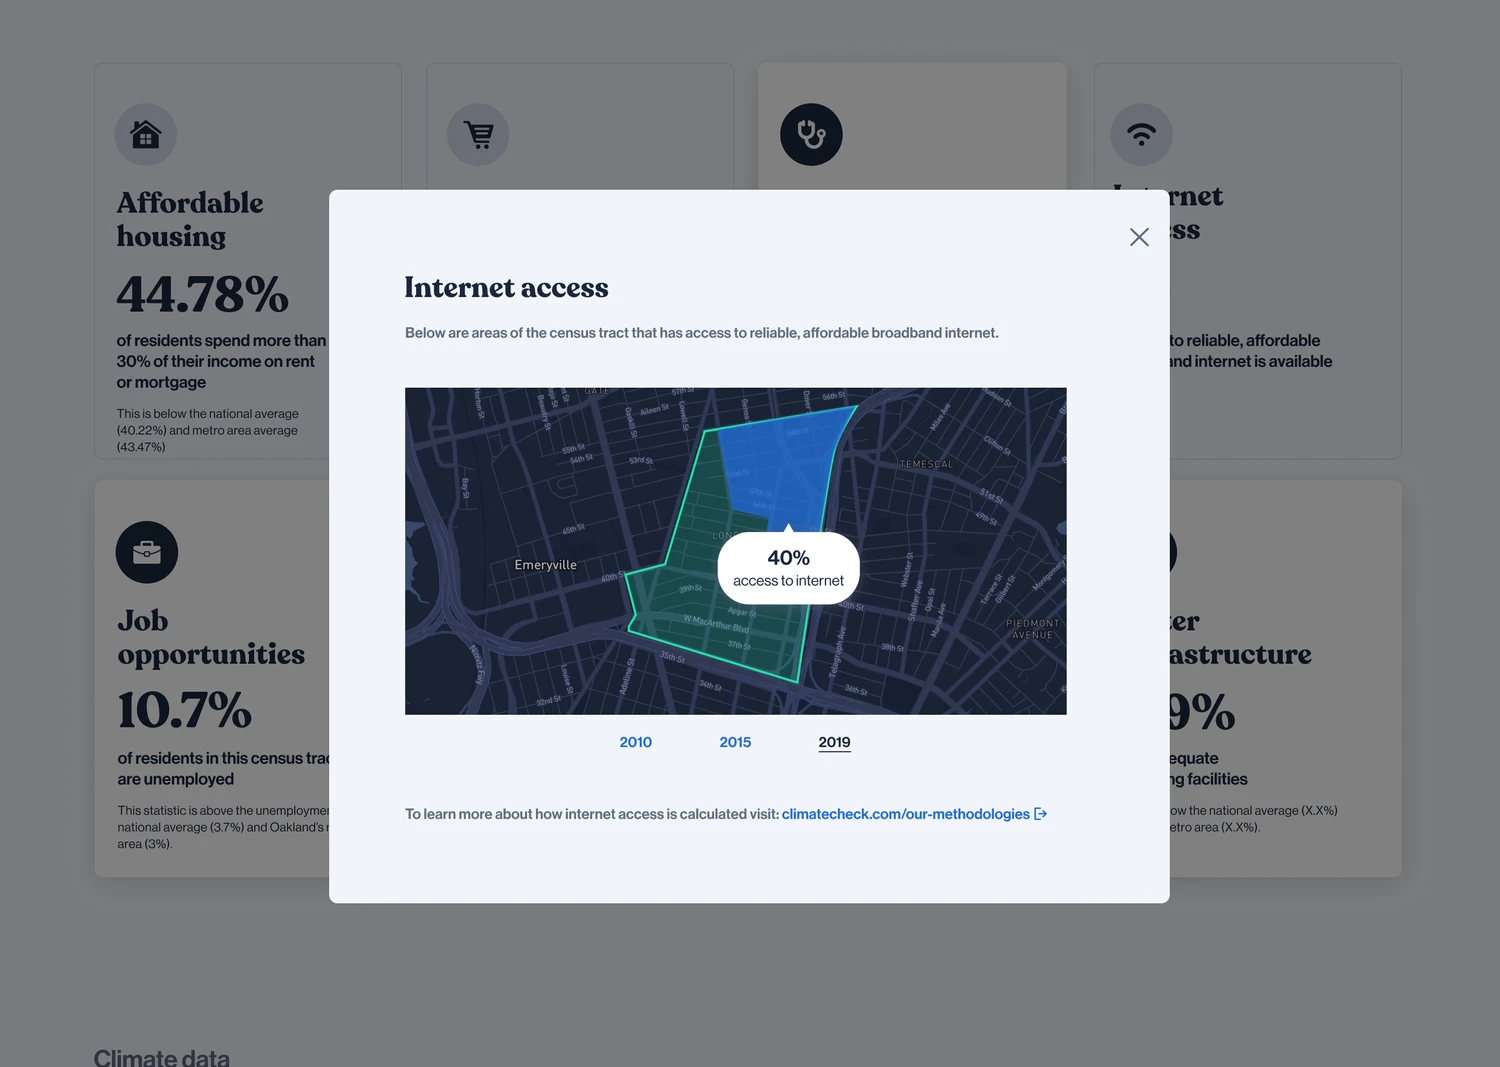
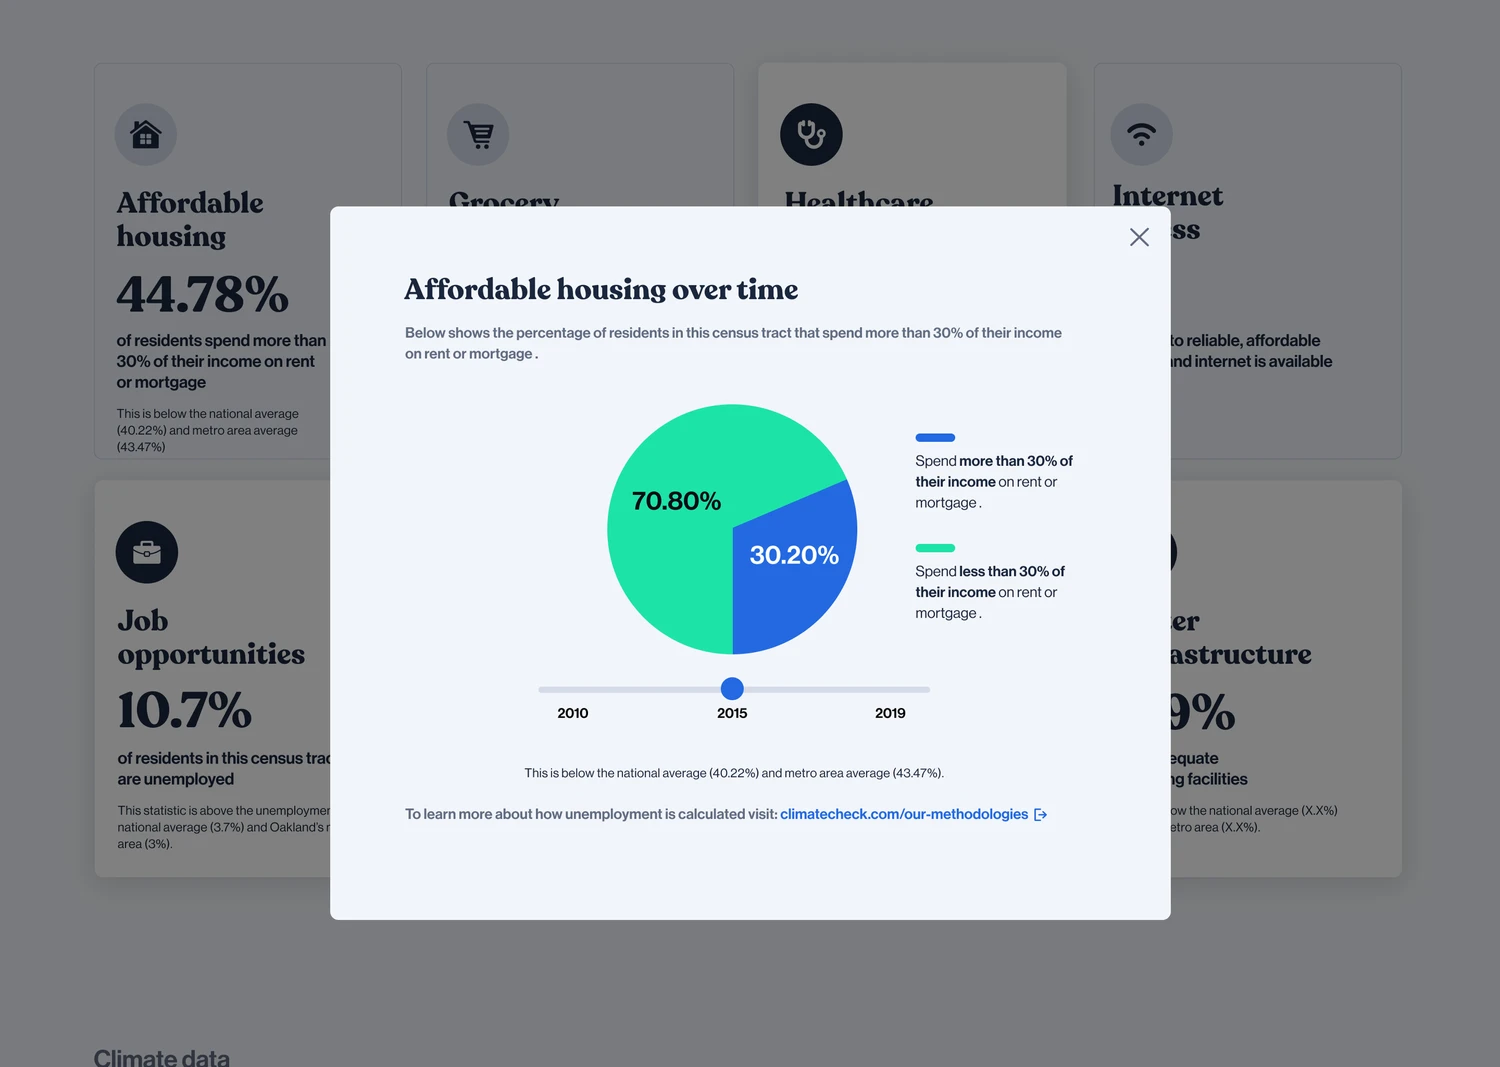
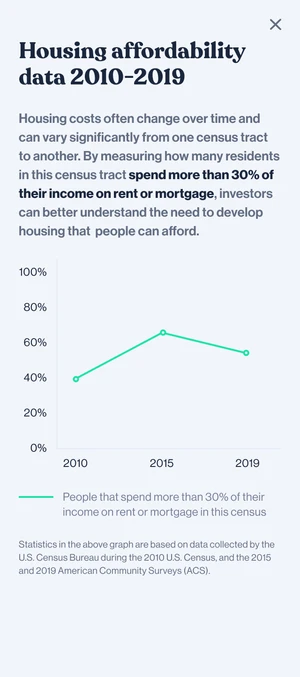
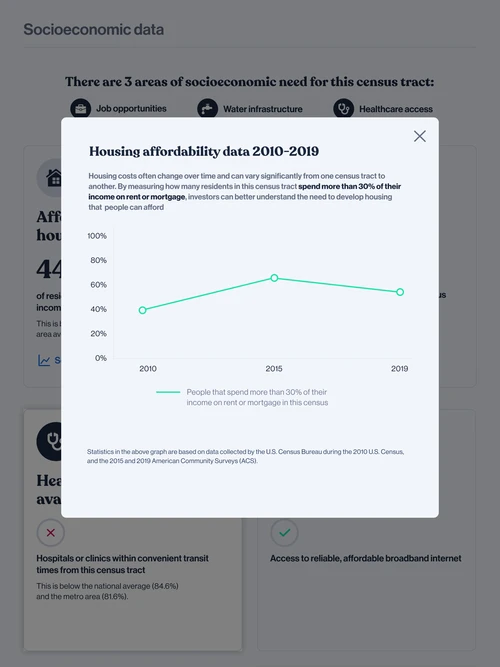
Final direction
Graphs that highlight exact data points that accommodate a range of data sets. We selected the interaction that best balanced discoverability, consistency, and complexity.


Understand incentive zones
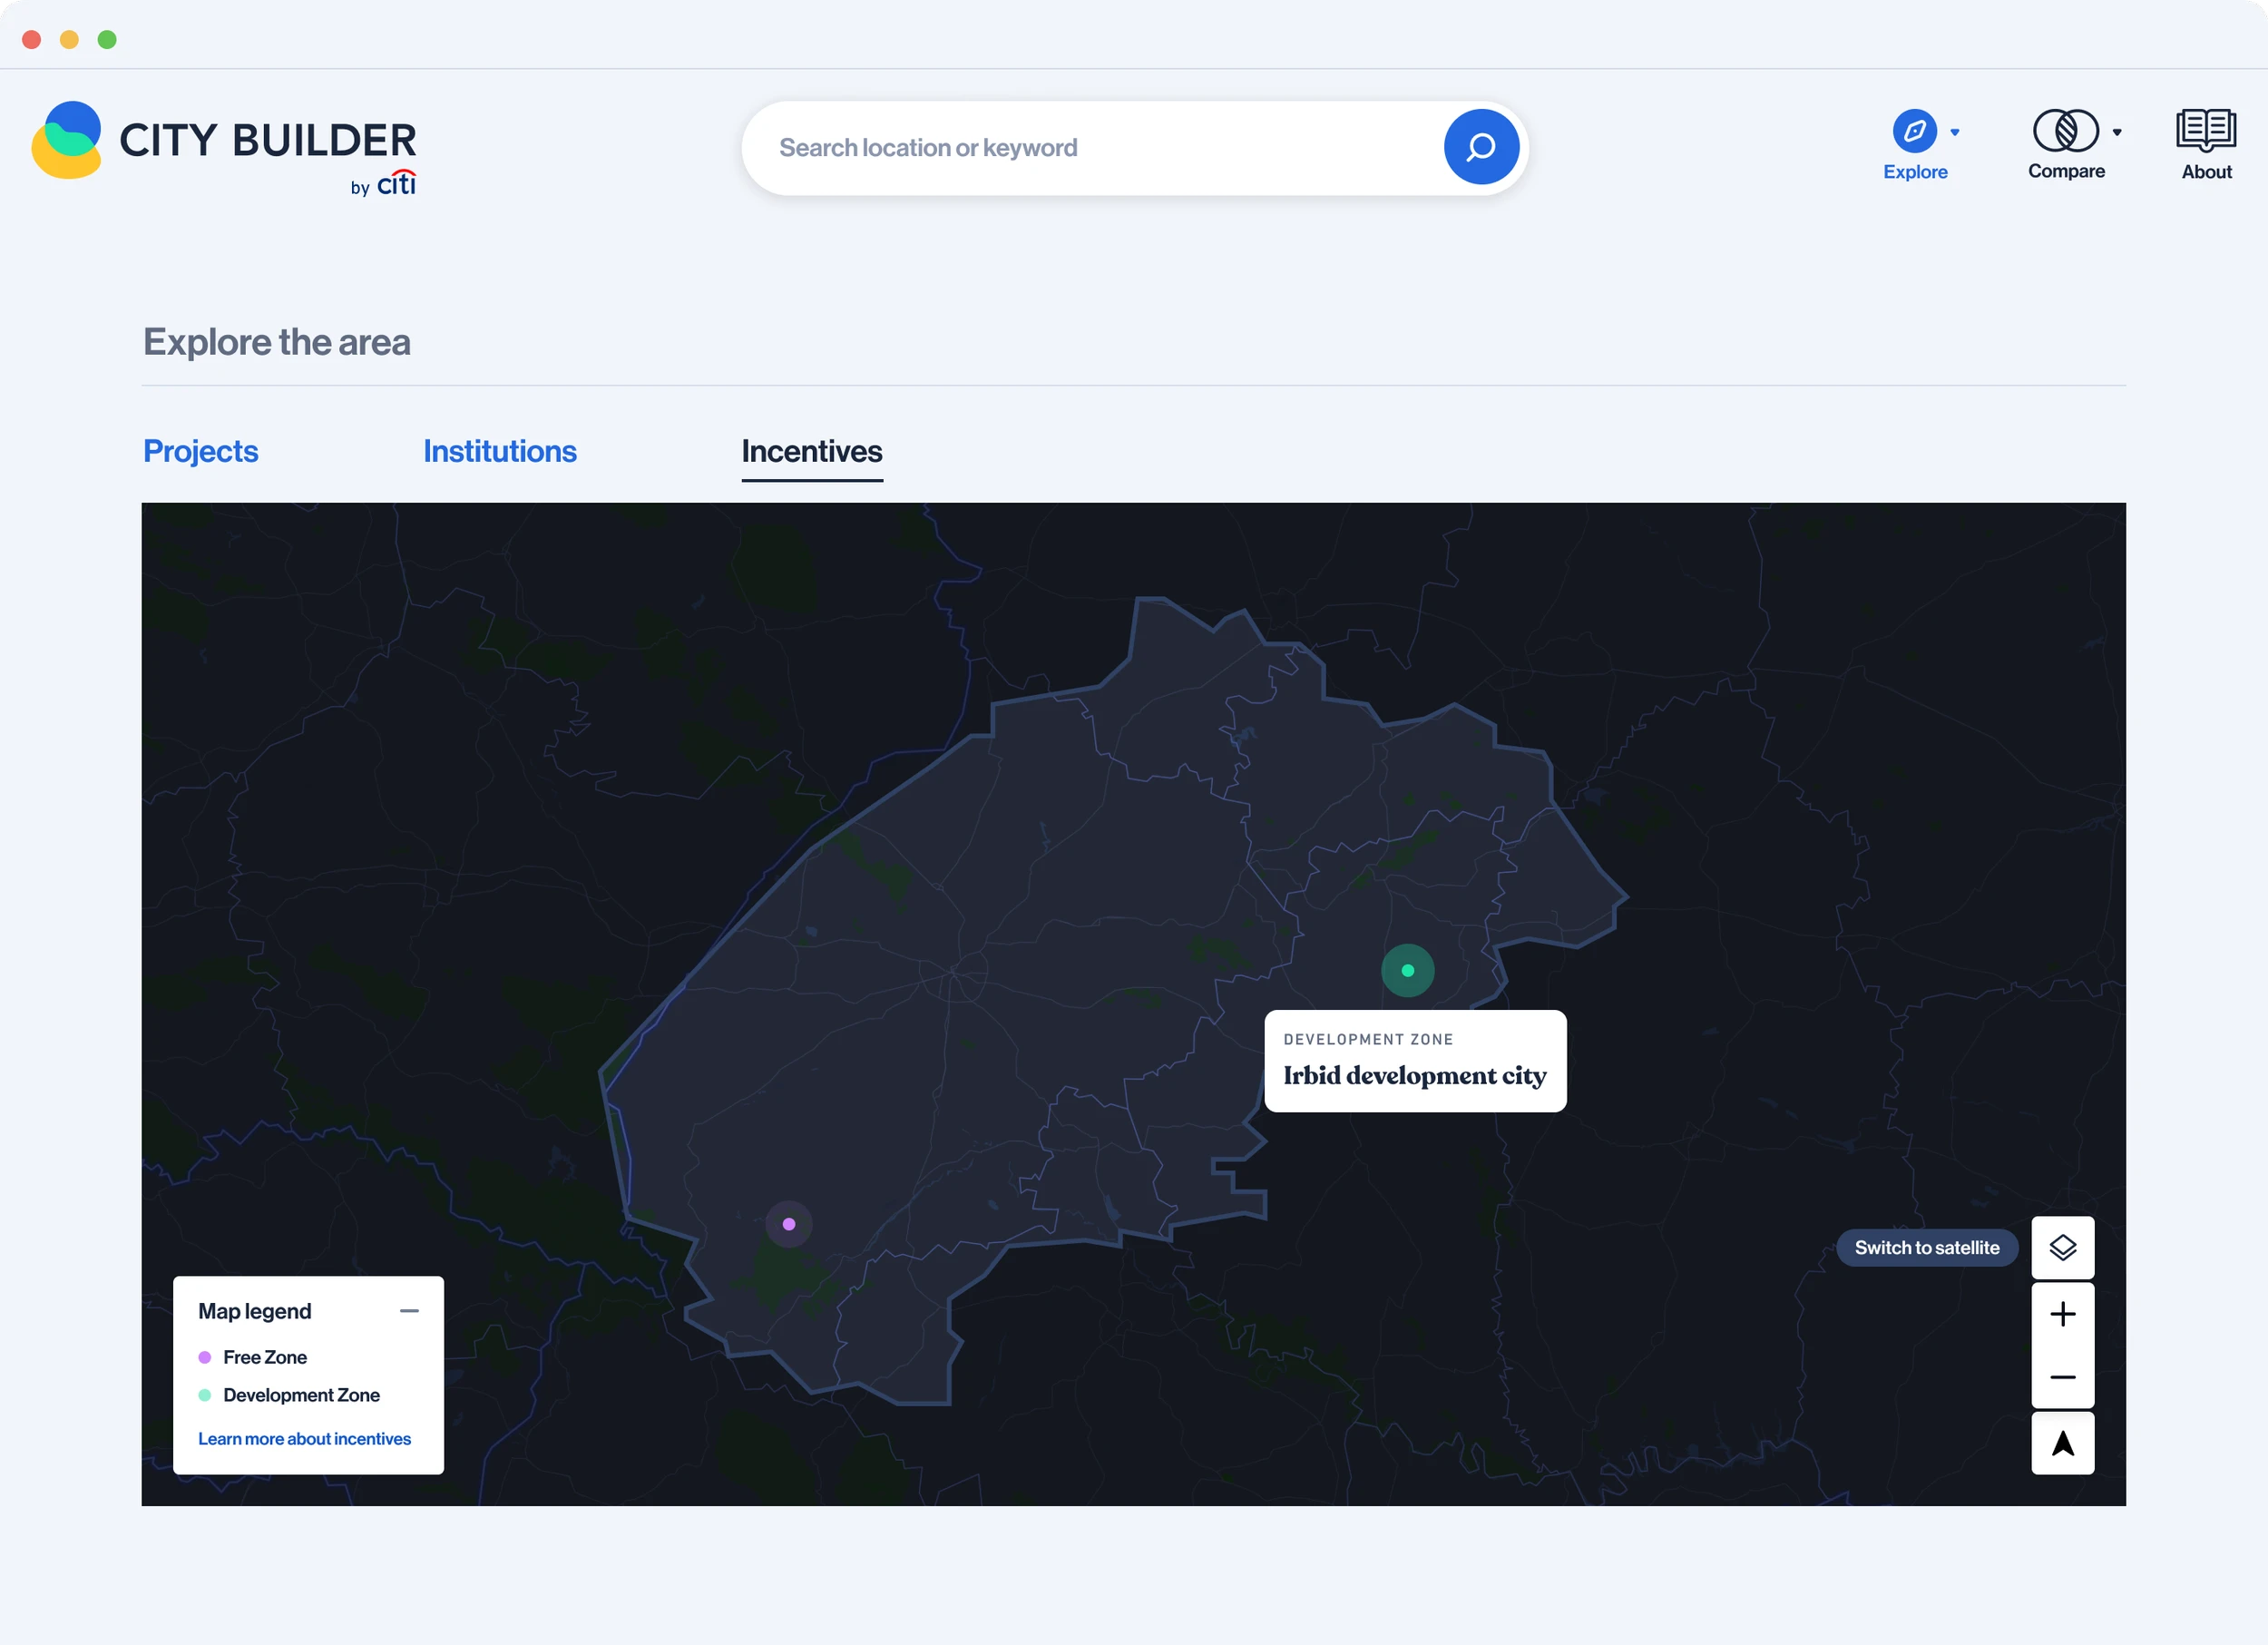
Investors weren't only interested in individual projects. They needed to understand how projects related to broader development and incentive zones.
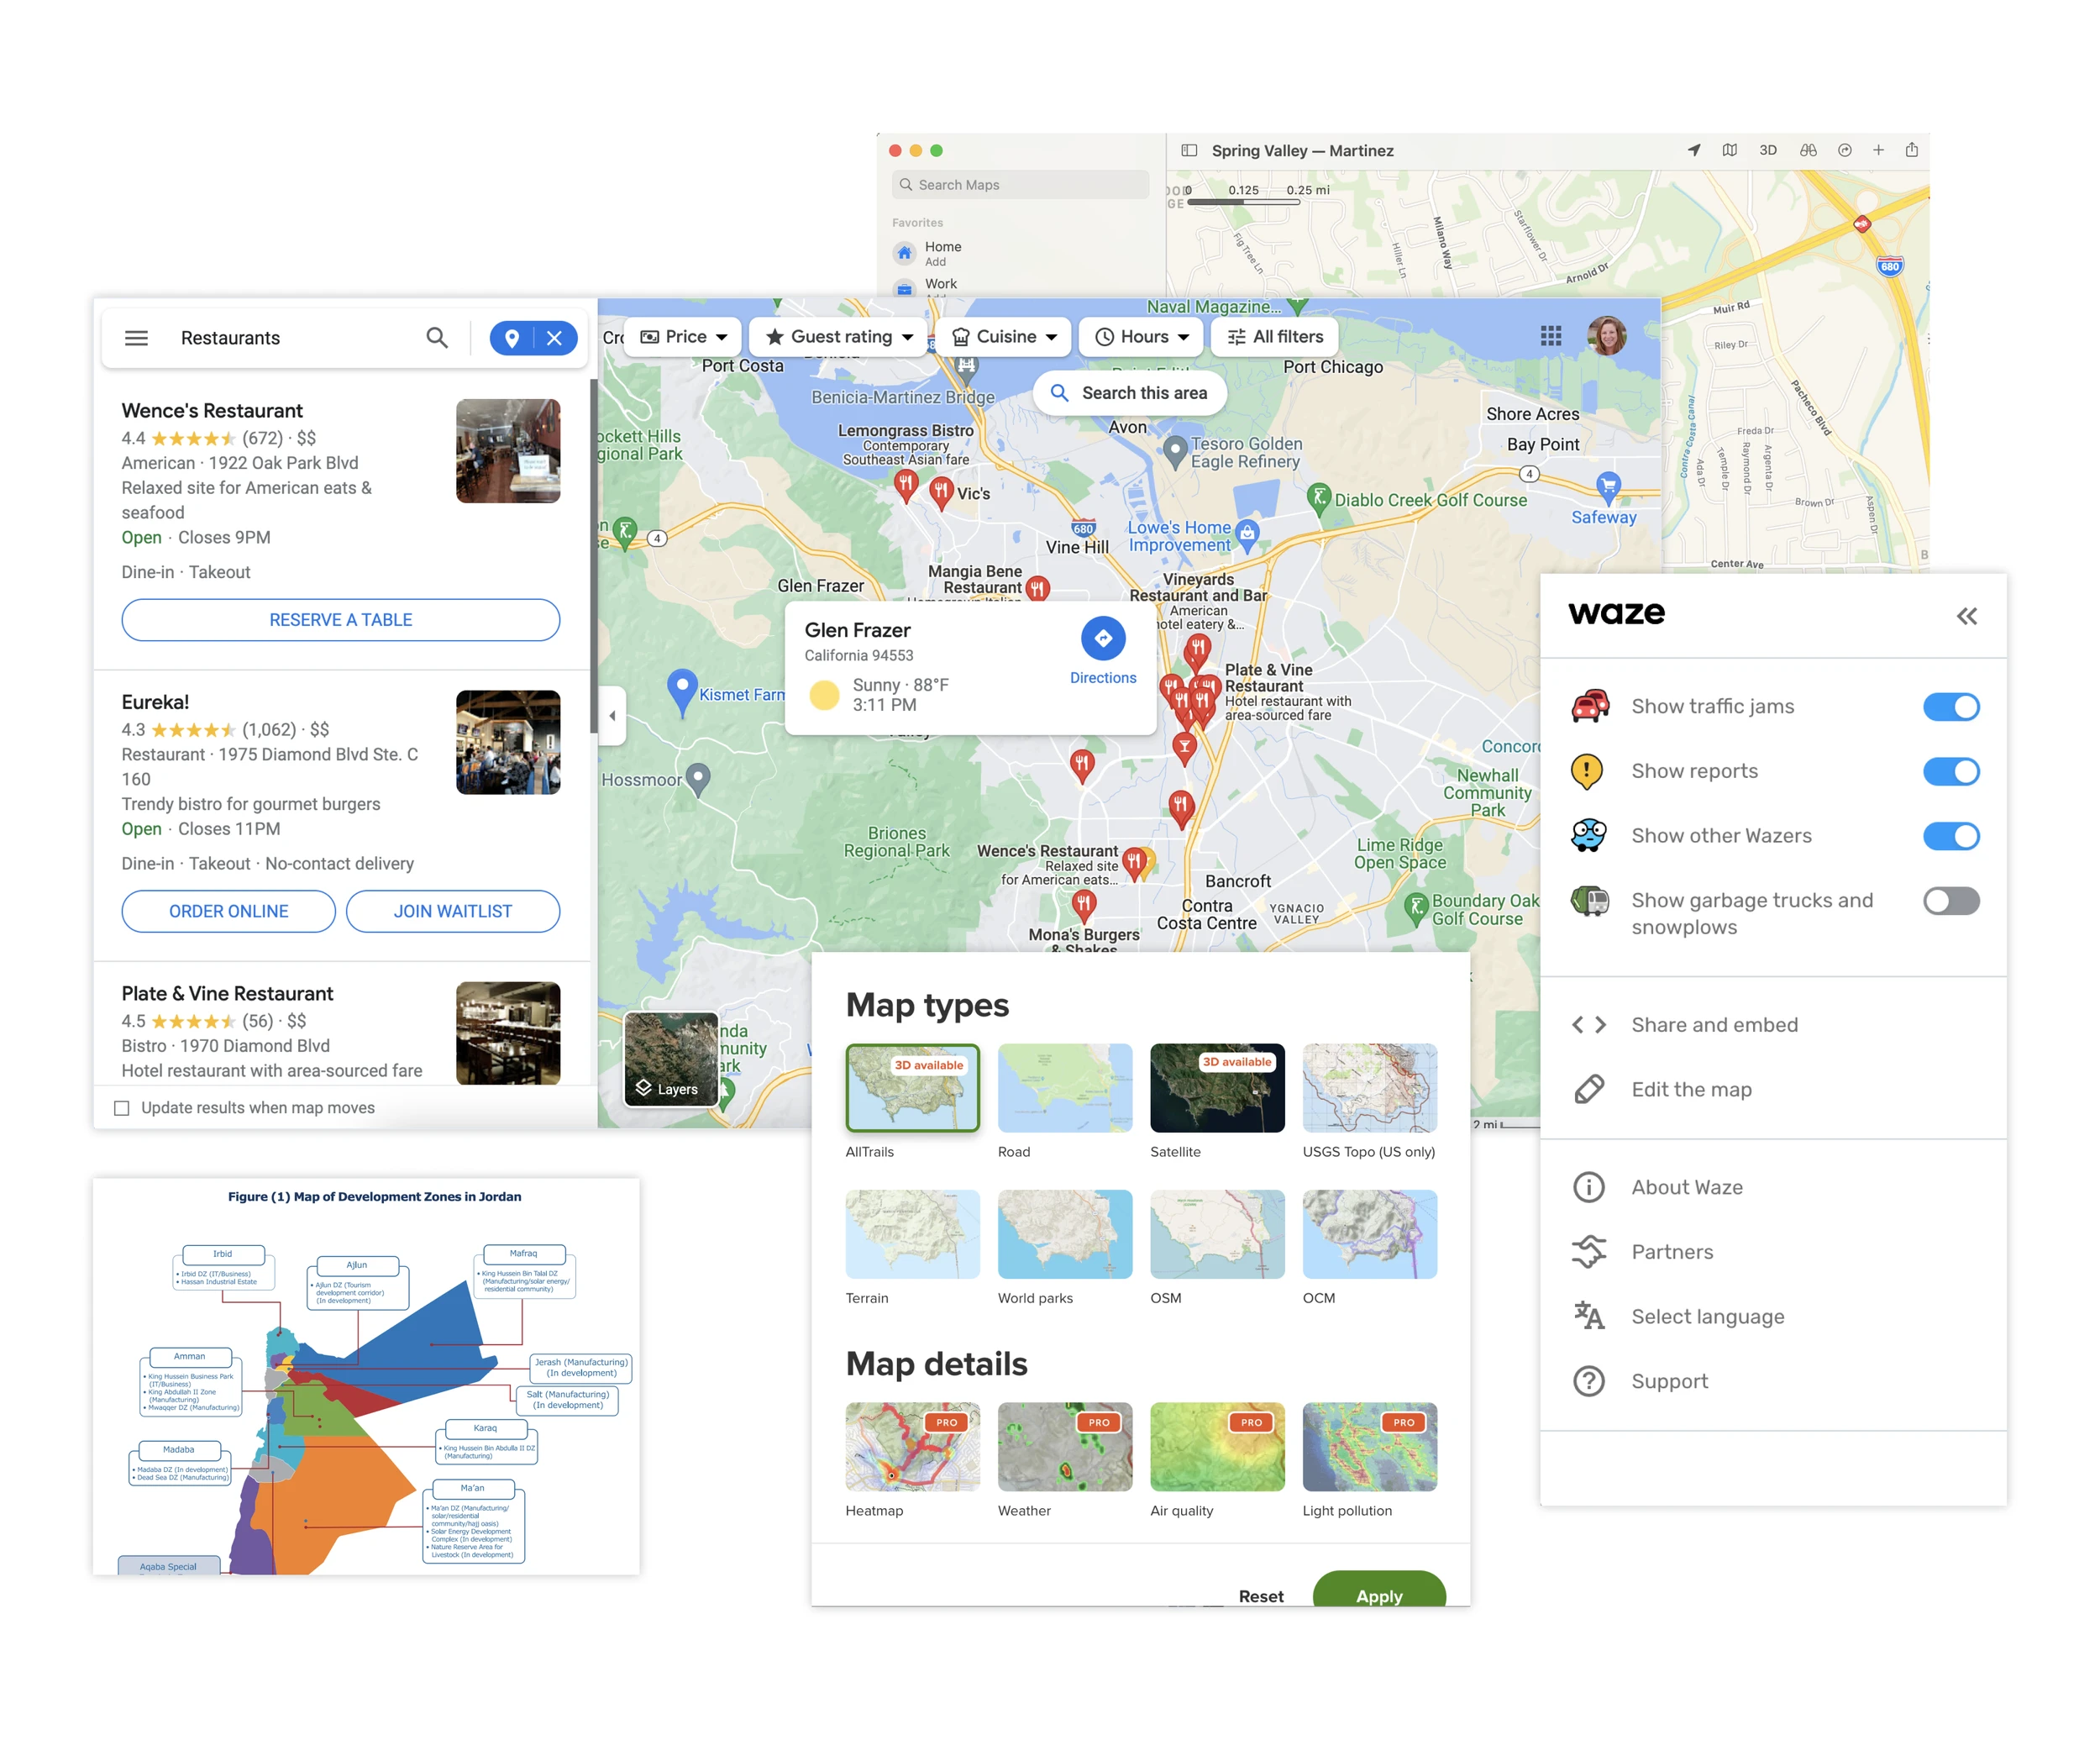
We were solving for how might we layer multiple types of information onto a map without overwhelming the user?

Benchmarking
Explored different maps and geography interactions
Ideation

Final direction
We chose separate tabs to keep the map consistent with existing City Builder patterns while giving incentive zones their own space.